
French solar engineering firm kiloWattsol says technical assessments show that capture price analysis is a more accurate measure of photovoltaic asset performance than France’s monthly M0 benchmark, as price volatility and negative wholesale prices increase.
Amid increasing market volatility and increasingly common low or negative price periods, it has become critical to understand the true value of a photovoltaic installation. In France, producers are compensated, either through aggregators or feed-in tariff schemes, based on a monthly average price known as M0. While this benchmark provides a useful reference point for the sector, it does not reflect the real performance of individual assets.
The French Energy Regulatory Commission (CRE) itself describes M0 as an ‘average sector indicator’ and notes that its calculation can mitigate important market signals. In practice, two PV installations with different production profiles do not generate the same market value, but are both paid for with the same monthly reference price. The difference between the average price and the price that a power plant actually yields determines a significant part of the economic value of a photovoltaic asset.
Real performance
At kiloWattsol, analysts quantify this gap by calculating the historical catch price of each project. The method uses real-world climate data to reconstruct a project’s hourly or sub-hourly production profile and applies historical market prices at 15-minute resolution when necessary to reflect short-term price dynamics.
The goal is not to model an uncertain future, but to determine how a project would have performed if it had been operational for the past few years. Given the relative stability of solar energy generation patterns across France, this historical analysis highlights a project’s structural predisposition to value creation. An asset that follows periods of high prices remains at the top of the market.
A project that performs better than the M0 is not just a stroke of luck. It is one whose production profile aligns with periods when prices rise above average, usually when demand peaks. Installations equipped with trackers slow down the decline in production in the afternoon and slightly advance the increase in the morning. These production shifts often coincide with periods that are valued more highly by the electricity system. As a result, such projects naturally generate more value than the monthly M0 benchmark.
The two graphs below illustrate this dynamic:
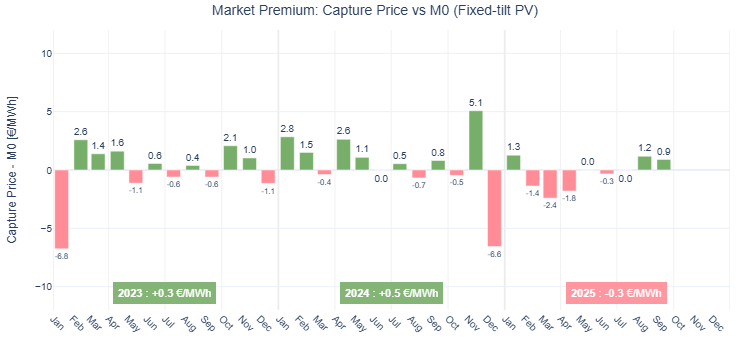
In each case, the analysis compares the monthly capture price of the power plant with the corresponding M0. The trend is clear. The fixed tilt plant remains close to M0 with a slightly positive but moderate performance. The tracker factory performed excellently for almost the entire year.
The annual difference summarizes this dynamic: +€2.70 ($3.12)/MWh, +€2.70/MWh and +€3.60/MWh over three years for the tracker installation, compared to +€0.30/MWh, +€0.5/MWh, and then a slight underperformance in 2025 for the fixed tilting installation.
Strategic challenge
These differences are not marginal. For a large-scale asset, these can amount to tens of thousands of euros annually and directly impact the resilience of the project at structurally low prices, market share performance under a contract-for-difference (CfD) regime, portfolio valuation during due diligence or refinancing, and the suitability of a particular design or technology in specific regions.
As conversations about negative prices, cannibalization, and hourly efficiency increase, analysis of commitment prices has become indispensable. Not all PV projects deliver the same value to an aggregator, yet this distinction often remains unquantified. The M0 provides a baseline, but obscures the diversity of project behavior. The catch price, on the other hand, brings this diversity into focus.
In a market where value is defined in 15-minute increments, comparing an installation’s performance to the M0 is no longer theoretical. It is a strategic variable for asset owners, investors and aggregators. One conclusion stands out: PV assets should not be valued uniformly. The challenge is to understand and demonstrate why.
The views and opinions expressed in this article are those of the author and do not necessarily reflect those of the author pv magazine.
This content is copyrighted and may not be reused. If you would like to collaborate with us and reuse some of our content, please contact: editors@pv-magazine.com.
Popular content