
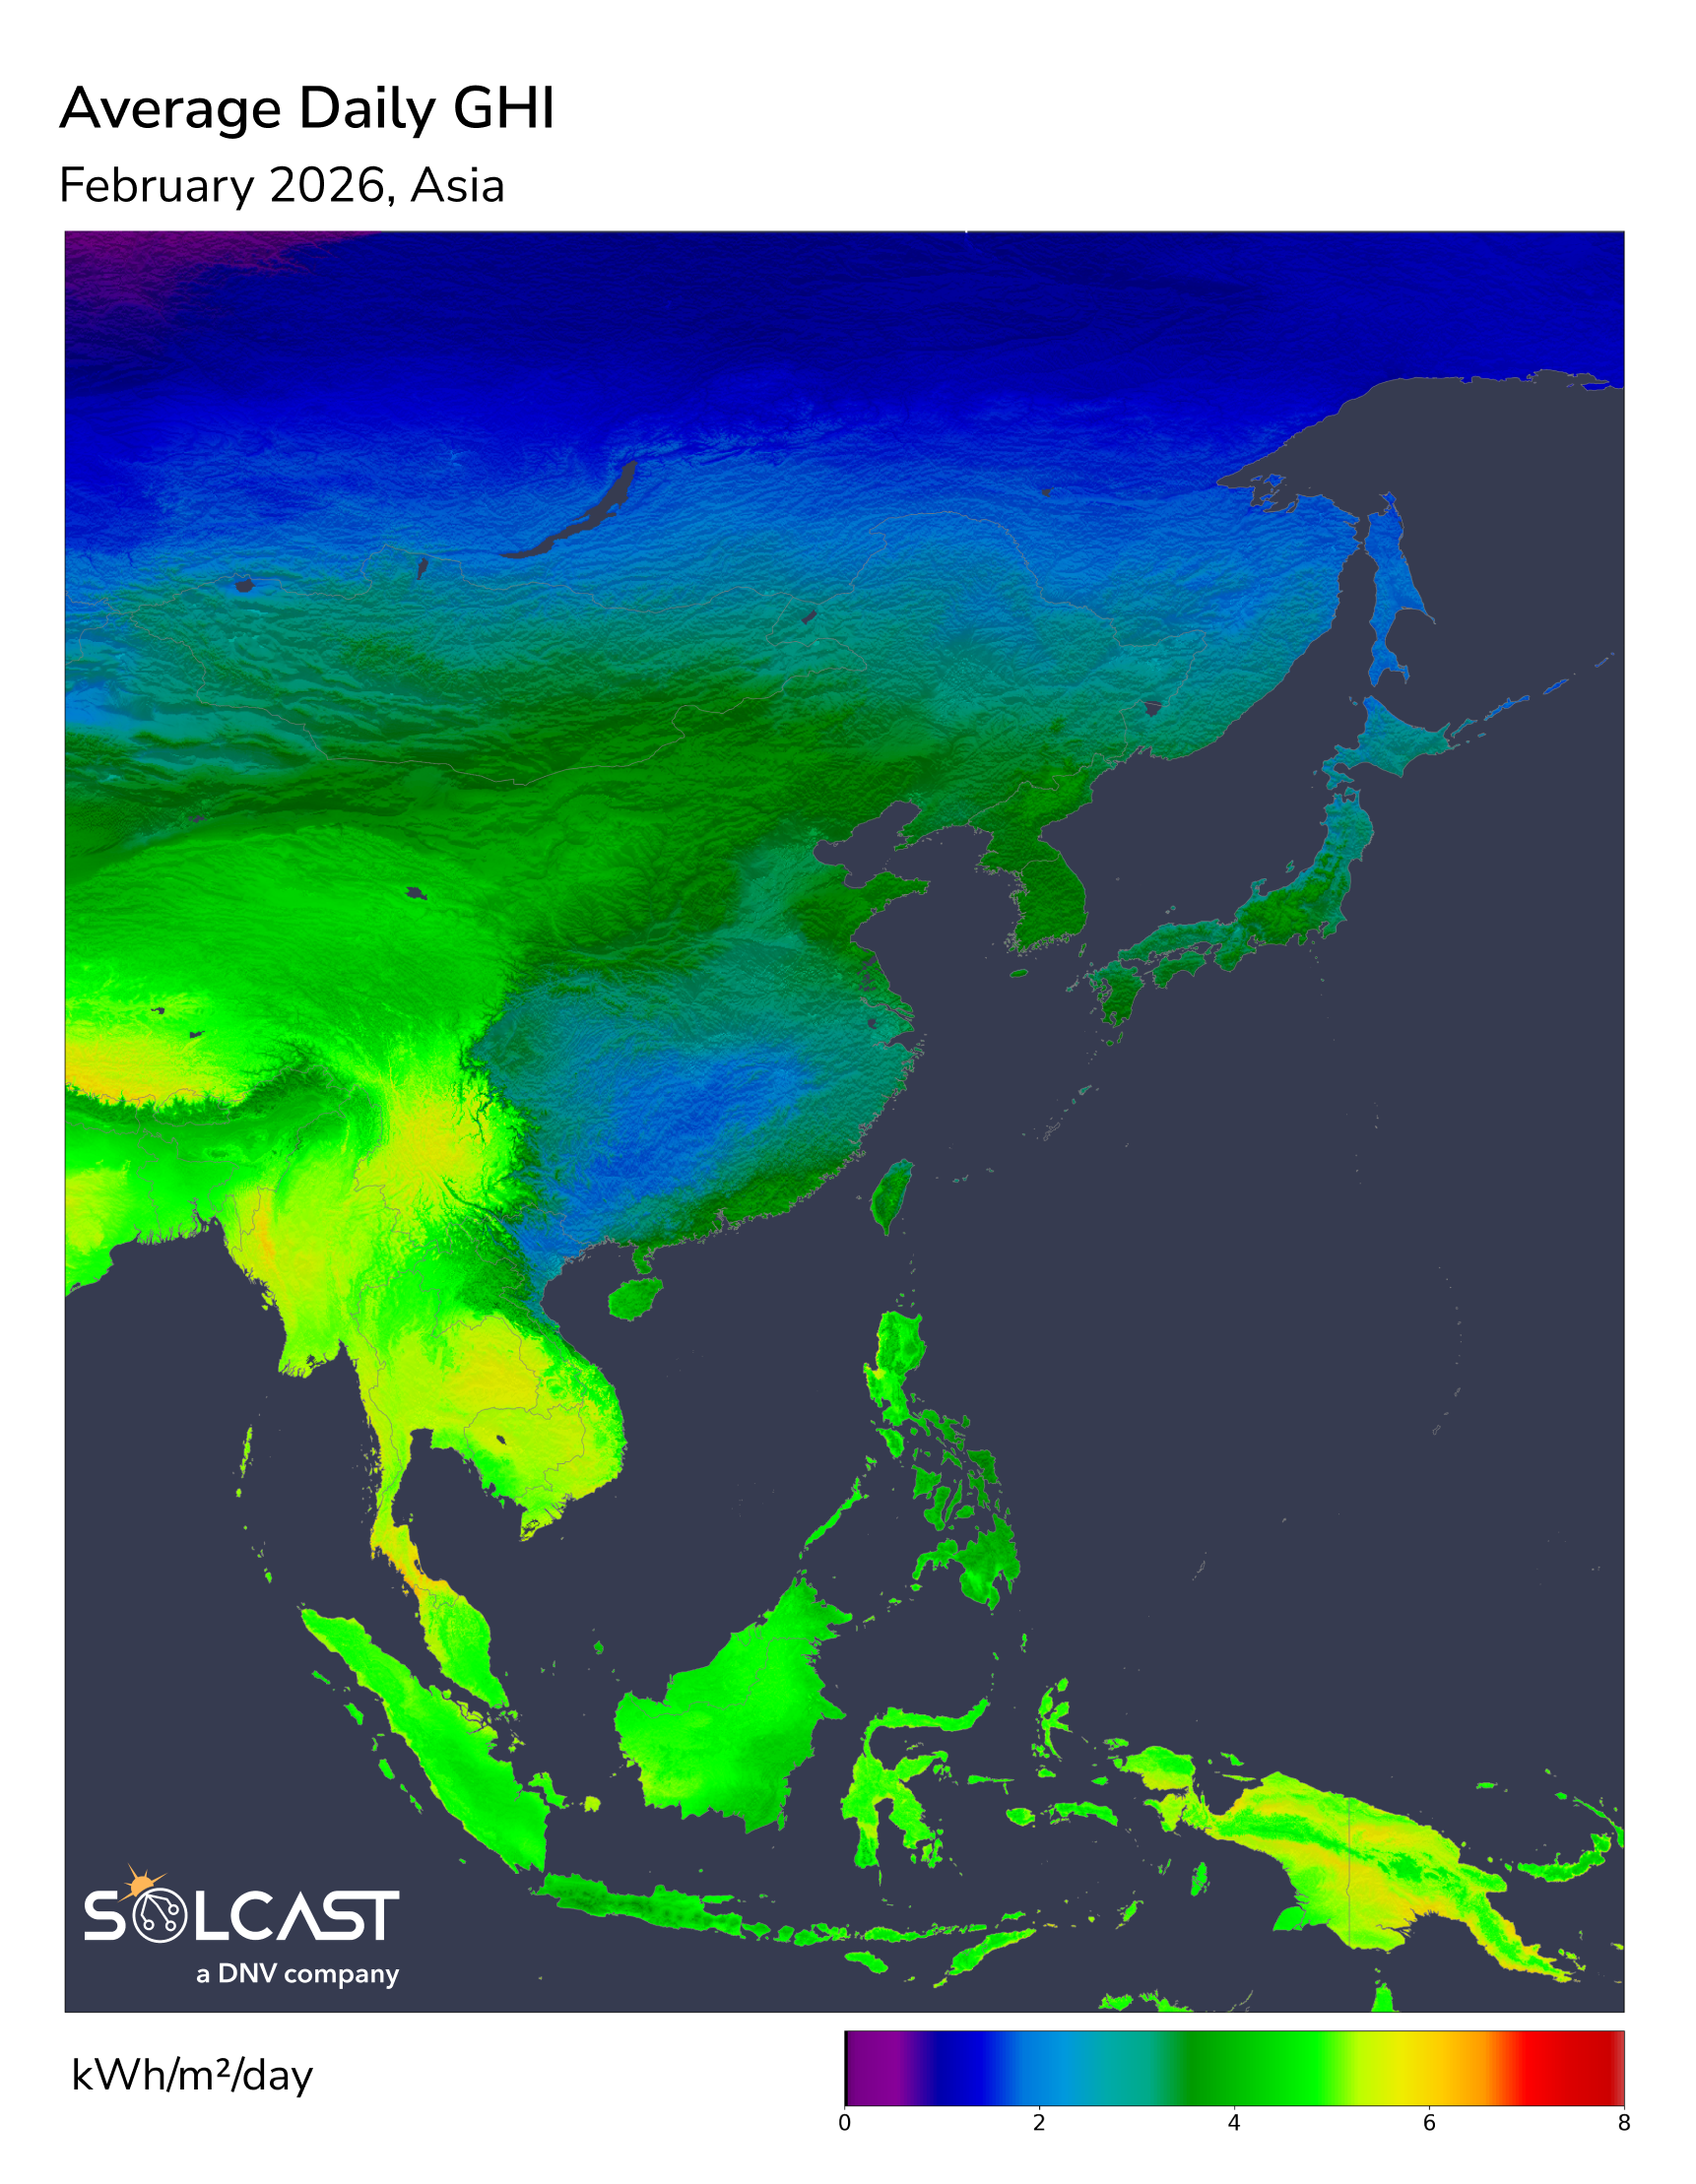
In a new weekly update for pv magazineSolcast, a DNV company, reports that there was a sharp solar gap in East Asia in February, with southern China and Taiwan experiencing record high insolation due to clear skies and low aerosols, while maritime Southeast Asia experienced heavy rainfall and below-average insolation due to increased tropical convection. China’s surplus was driven by atmospheric cleanliness, while Taiwan’s boost was mainly due to persistently clear days, contrasting with widespread shortages in Indonesia, the southern Philippines and nearby islands.
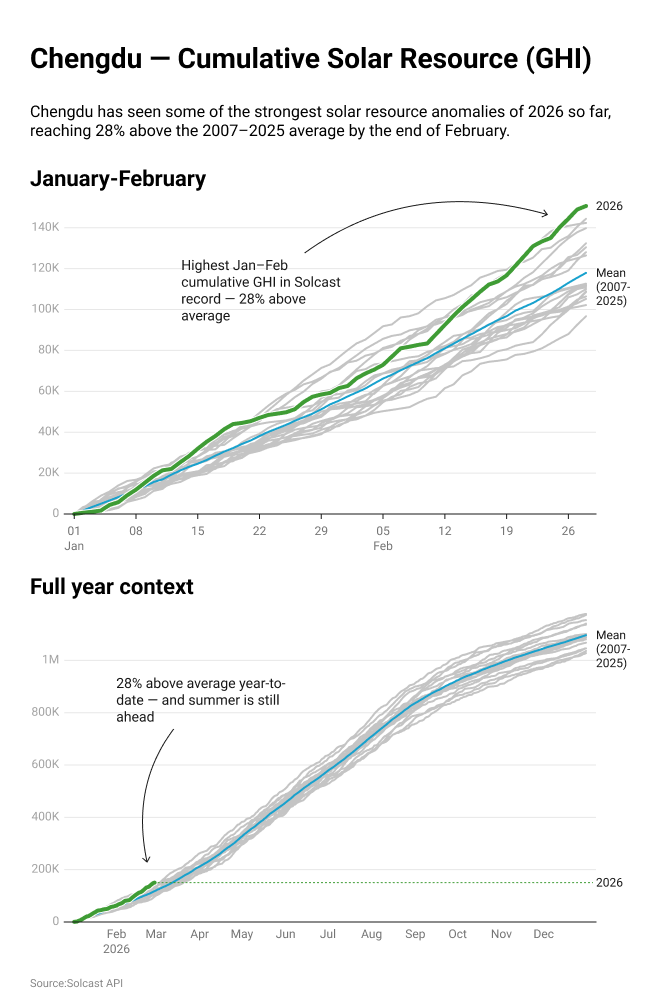
February created a major regional gap in solar energy resources in East Asia, according to an analysis using the Solcast API. Southern China and Taiwan recorded some of the strongest positive radiation anomalies in the past two decades, driven by exceptionally clean air and a sharp reduction in cloud cover. At the same time, maritime Southeast Asia saw the opposite pattern, with increased tropical convection producing widespread rainfall and some of the lowest insolation compared to normal for the month.
The above-average insolation in southern China continued from January, but the underlying mechanism changed significantly. In inland provinces such as Sichuan and Yunnan, clearsky’s GHI was more than 10% above the long-term average, indicating unusually low aerosol and water vapor loads. This was the strongest clear sky signal of the winter and points to atmospheric cleanliness rather than large-scale pressure patterns as the main driver. The overall GHI anomalies were even larger, exceeding more than 20% above average in some areas, confirming that the reduced cloud cover enhanced the clear sky surplus.
Unlike January, when a strong Siberian high pushed dry continental air southward, the February pattern was dominated by a deep low-pressure anomaly over Mongolia and northern China. Despite this less stable arrangement and increased humidity, precipitation in mainland China remained near normal, limiting cloud cover inland. A temporary reduction in industrial emissions around the Chinese New Year holidays may have further reduced aerosol loads, in line with a longer-term trend of cleaner air and a boost in radiation across central China.
Taiwan experienced an even more pronounced shift, with irradiance rising sharply in February from already high levels in January. Taipei reached 17.7% above the 2007-2025 average, up from 11.7% in January, and Taichung saw a similar increase from 9% to 15%. In contrast to southern China, the surplus in Taiwan was almost entirely caused by less cloudy days. Clearsky’s GHI was only 4 to 5% above normal, while the overall GHI rose to 15 to 18% above average, indicating that February brought unusually persistent clear conditions across the island. This happened despite the collapse of the Siberian high mountains that had previously channeled dry air through the Taiwan Strait. While cities like Seoul and Tokyo returned to near-normal irradiance when that winter pattern broke, Taiwan and the nearby Shanghai region became notable high-irradiance zones along the East China Sea.
Further south, maritime Southeast Asia experienced markedly different conditions. Indonesia, the southern Philippines and surrounding island chains showed clear deficits of 10 to 20% below average, accompanied by substantial overall reductions in GHI. Precipitation exceeded normal at 8-12 mm/day over Sumatra, Java, Borneo and the equatorial Pacific, reflecting stronger tropical convection. The combined clear-sky and cloud-driven deficits indicate a wetter, more moisture-laden environment consistent with a transition from La Niña to ENSO-neutral conditions, which generally enhance convection over the western Pacific warm basin.
Solcast produces these figures by tracking clouds and aerosols worldwide at a resolution of 1-2 km, using proprietary satellite data AI/ML algorithms. This data is used to drive irradiance models, allowing Solcast to calculate high-resolution irradiance, with a typical deviation of less than 2%, as well as cloud tracking predictions. This data is used by more than 350 companies that manage more than 300 GW of solar energy worldwide.
The views and opinions expressed in this article are those of the author and do not necessarily reflect those of the author pv magazine.
This content is copyrighted and may not be reused. If you would like to collaborate with us and reuse some of our content, please contact: editors@pv-magazine.com.
Popular content