

Day-ahead markets in the EU-27 remained below zero for 1,223 hours in the first quarter of 2026. That’s more than double the 593 hours recorded in the first quarter of 2025 and more than ten times the recent low of 119 hours in the first quarter of 2022. This total masks differing national stories. Spain alone accounted for 347 of those hours, while Finland and Sweden returned to zero after big increases last year. In April 2026, Germany cleared 123 of the 720 sub-zero hours, and on the same days, day-ahead generation forecasts and actual delivered production diverged most sharply.
Negative price hours in Q1, 2019 to 2026
The Q1 series over the eight years from 2019 to 2026 shows where structural pressure has built up and where it has stabilized.
Image: ENTSO-E Transparency Platform
Spain is the most notable mover in the dataset. Before 2023, Spain had never recorded an hour of negative prices in the first quarter. The number rose to 21 in 2023, rose to 168 in 2024, fell back to 73 in 2025 and then rose to 347 in the first quarter of 2026, equivalent to 16 percent of all trading hours in the first quarter. Portugal followed the same Iberian pattern, reaching 294 hours in the first quarter of 2026, compared to a baseline of 8 in 2023. Greece went from zero in the first quarter of 2025 to 138 hours in the first quarter of 2026, the largest year-on-year increase in the table.
Poland only started recording negative first quarter hours in 2025, with 56 hours that year and 52 in 2026. Germany settled into a 40 to 50 first quarter hour range in 2024, 2025 and 2026, well below the previous peak of 131 hours in the first quarter of 2019. Finland and Sweden’s SE2 zone each rose in 2024 and 2025, peaking at 85 and 41 hours respectively, before returning to zero in the first quarter of 2026. That pattern reflects demand for hydroelectric storage and heating rather than oversupply of solar energy, and is out of step with the Iberian trajectory. Italy has not recorded a single negative price hour in the first quarter in the entire eight-year series.
The first quarter is also the mildest quarter of the year in terms of solar oversupply. The irradiance peaks in the second and third quarters, and the Iberian and Greek patterns visible in the first quarter, extend further into the year. The first quarter figures are therefore a floor for annual exposure rather than a representative quarter.
Depth of negative prices, full year 2025
Hour counts describe how often prices fall below zero. They don’t describe how far below zero. Breaking down the negative price hours for the entire year 2025 into depth bands for the six major PPA markets shows that markets with similar hour numbers can produce very different price events.
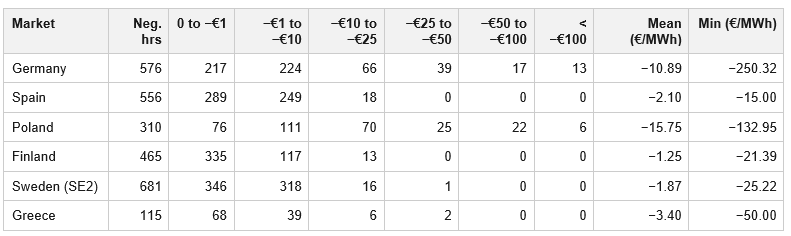
Image: ENTSO-E Transparency Platform
Germany recorded 576 negative hours in 2025 with an average clearing price of −10.89 euros per MWh and a minimum of −250.32 euros per MWh. Thirteen hours fell below −100 euros per MWh. Spain recorded a total of 556 hours, but with an average of only −2.10 euros per MWh and a minimum of −15.00 euros per MWh. Not a single Spanish hour fell below −25 euros per MWh throughout the year.
Poland is the most volatile of the six markets. The 310 negative hours had an average of −15.75 euros per MWh, the deepest of the group, and a minimum of −132.95 euros per MWh. The average depth in Poland tripled between 2023 and 2025, from −4.94 euros per MWh to −15.75 euros per MWh. The Scandinavian markets are at the other end of the distribution. The 465 negative hours in Finland averaged −1.25 euros per MWh, with no hour falling below −25. The Swedish SE2 zone showed a similar shallow profile for 681 hours. Greece recorded 115 hours with an average of −3.40 euros per MWh and a minimum of exactly −50.00 euros per MWh.
The same hour count figure can therefore describe very different financial events. A Spanish year of 556 hours and a Polish year of 310 hours are not comparable in terms of price impact. Poland’s average is roughly seven and a half times deeper than Spain’s, and its tail extends nine times further from zero.
Germany, April 2026: forecast error, containment or both?
Negative prices in Germany are often presented as a simple story about sustainable energy. More wind and solar energy in a system with limited flexibility provides more hours without marginal costs. Day-ahead data from April 2026 tells a more specific story. The hours when prices fell below zero are also the hours when forecasts of day-ahead generation and actual delivered production diverged most sharply.
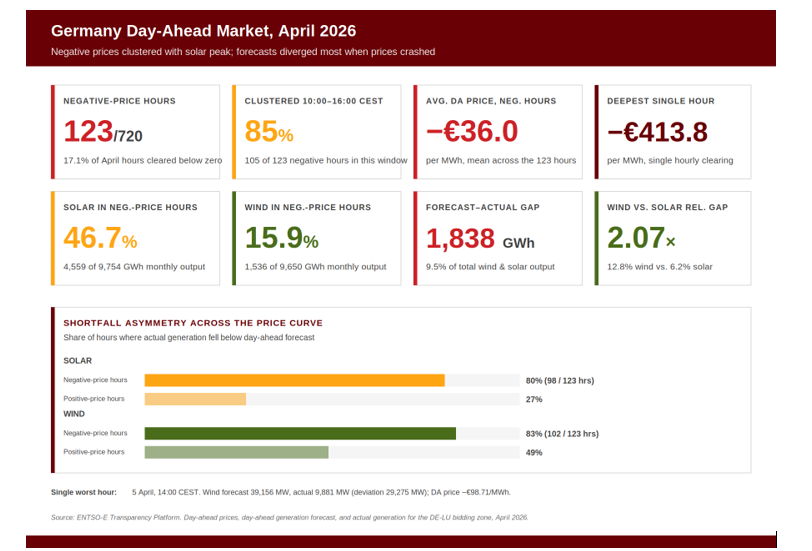
Image: ENTSO-E Transparency Platform
In April, 123 of the 720 hours, or 17.1 percent of the month, were settled at a negative day-ahead price. Of those 123 hours, 105, or 85 percent, fell within the 10 a.m. to 4 p.m. CEST time frame, the strongest solar production block of the day. The average clearing price over the 123 negative hours was −36.0 euros per MWh. The deepest hour cleared at -413.8 euros per MWh.
This concentration is reflected in the share of monthly generation that is supplied at negative prices. Solar energy produced 9,754 GWh in April, of which 4,559 GWh, or 46.7 percent, was supplied during negative price hours. Wind produced 9,650 GWh, of which 1,536 GWh, or 15.9 percent, was delivered during negative price hours. Nearly half of the month’s solar energy production was therefore monetized at a sub-zero price.
The difference between expectations and the actual situation was significant in absolute terms. The combined absolute deviation between the day-ahead forecast and actual generation was 1,838 GWh in April, equivalent to 9.5 percent of total wind and solar energy production for the month. The relative gap was 6.2 percent for solar and 12.8 percent for wind, making the wind gap 2.07 times larger than the solar gap on a comparable basis.
The more revealing finding is that this gap is asymmetrical across the price curve. During negative price hours, actual generation fell below the day-ahead forecast in 80 percent of solar hours, 98 of 123, and 83 percent of wind hours, 102 of 123. During positive price hours, the same deficit share fell to 27 percent for solar and 49 percent for wind. Solar energy fell short of forecast almost three times more often when prices were negative than when they were positive. The cumulative shortage during negative price hours alone was 240 GWh for solar energy and 464 GWh for wind energy.
There are two mechanisms causing the same deficit, and the data set cannot separate them. The first is a real forecast error in that the weather deviates from the model used by the TSO and market participants prior to the closure of the gate. The second is curtailment, where turbines and inverters are slowed down by the TSO or by market signals when prices collapse. Both leave an identical signature in the data. Predicted megawatts that never show up as delivered megawatts. Distinguishing between these requires plant-level shipment data and containment instructions that are not published in this dataset.
The most extreme hour of the month was April 5 at 2:00 PM CEST. Wind production was forecast at 39,156 MW; actual generation was 9,881 MW. The deviation of 29,275 MW coincided with a day-ahead price of −98.71 euros per MWh in that hour. April 5 was also the worst day of the month, with a cumulative wind forecast difference of 232 GWh.
Over a month and a bidding zone, the largest predicted and actual differences correspond to times when the market had already factored in abundance. The pattern is consistent and not random.
How Ricardo’s electricity market prospects can help
Should you anticipate when negative prices will reach your bidding zone, and how deep they will be? Want to know what portion of your asset’s revenue ends up in negative price hours? To provide a CfD that does not pay for containment?
Ricardo’s Electricity Market Outlook (EMO) was developed to answer these questions. The underlying model, PRIMES-IEM, underlies twenty years of policy analysis by the European Commission. It manages all European markets simultaneously until 2050, deriving cross-border flows by replicating the EUPHEMIA algorithm used by ENTSO-E.
The outputs include hourly prices, capture rates, depth and frequency of negative prices, exposure to curtailments and BESS profitability forecasts at country and asset levels. These are the quantitative inputs that CfD bidding prices and project bankability matters require.
Methodology
All figures are reported hourly using data from the ENTSO-E Transparency Platform, covering day-ahead prices, day-ahead generation forecasts and actual generation ranges at bidding zone level. The day-ahead markets in the EU switched from an hourly market time unit to a 15-minute market time unit on October 1, 2025. Quarterly settlements from that date have been merged into hourly segments based on the arithmetic average of the four 15-minute prices within each hour, keeping the 2019 through 2026 series consistent. The EU-27 total includes the EU Member States represented in the ENTSO-E day-ahead data, i.e. the EU-27 excluding Cyprus and Malta, which are not part of the Single Day-Ahead link. Norway is excluded. Means and minimums are simple arithmetic averages over negative hourly prices. Germany and Luxembourg share the DE-LU bidding zone and are reported jointly. The forecast actual gaps for the April 2026 section are calculated as the absolute difference between the ENTSO-E day-ahead generation forecast and the actual generation, per hour, for the DE-LU bidding zone.
Author: Safa Sen, Market Engagement Lead for CWE at Ricardo, member of WSP.
Ricardo is a member of the professional services firm WSP Group, which unites technical, consulting and scientific expertise to shape communities and advance humanity. From local beginnings to a global presence today, it operates in more than 50 countries, providing solutions and delivering innovative projects across sectors: transportation and infrastructure, real estate and buildings, earth and environment, water, energy and mining and metals.
The views and opinions expressed in this article are those of the author and do not necessarily reflect those of the author pv magazine.
This content is copyrighted and may not be reused. If you would like to collaborate with us and reuse some of our content, please contact: editors@pv-magazine.com.
Popular content