

Reliable assessment of the local solar radiation source is an important part of the development and financing of large-scale PV power plant projects. This assessment is generally based on the assumption that long-term average annual solar radiation from previous years does not differ significantly from the expected future availability of solar energy. In many parts of the world, solar radiation availability in 2023 was significantly higher (up to 10-12%) than the long-term average, and this could overshadow the fact that a large proportion of large-scale PV power plants are underperforming.
Björn Müller and colleagues published an article in the ISES Solar Energy Magazine discussing issues surrounding the assessment of the solar radiation source in the context of long-term variations often referred to as ‘global dimming and brightening’.
They argue that in view of long-term trends that may extend beyond the period of previous observations and the expected lifetime of a solar power plant, a paradigm shift can be proposed: instead of (or perhaps in addition to) using the longest possible period to To calculate an average value, only the ten most recent years should be used as an estimator for future solar radiation.
In their 2014 paper, based on German Meteorological Service data from eight observation stations across Germany with more than 40 years of global horizontal irradiance (GHI), it was found that the period for the dimming period extended from the beginning of the dataset 1951 , until 1983, while the clearing period started in 1984 until the end of the data set in 2010.
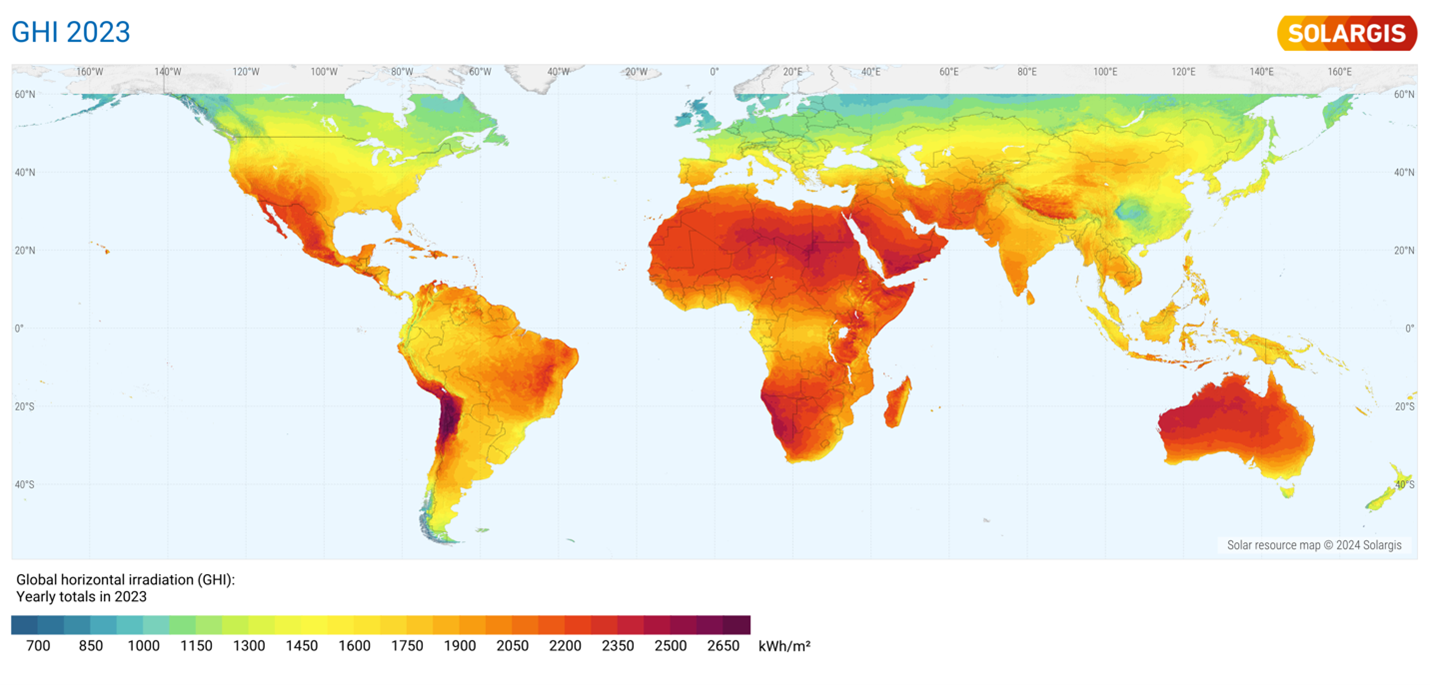
Solargis® recently published a GHI series of solar maps that demonstrate this solar radiation in 2023 was higher than the long-term average (LTA) of annual totals over a period from 1994 to 2022 (with different start dates depending on region). The maps below show (top) the percentage deviation of the annual GHI in 2023 from the long-term average (GHI difference 2023) and (bottom) the GHI for 2023.
Detailed regional maps, covering different time periods depending on the region, are also available on the Solargis® website. GHI is the most important weather factor affecting the energy production of solar photovoltaic power plants. Having reliable and up-to-date information about GHI is critical to understanding whether a solar power plant is performing as expected or not.
Solar irradiance maps showing recent GHI values, such as the 2023 map, can be used as a preliminary and approximate reference, and can help identify the need to carry out a more detailed energy assessment in the event that the map values are not within the range of previously expected values, or if the map values are not aligned with on-site observations and actual energy generation, for PV installations already in operation.
In these cases, a new estimate of the expected long-term solar energy resources, including an updated monthly variability analysis, may be necessary, and an assessment of the on-site solar radiation sensors, plus a careful assessment of possible sources of underperformance in terms of solar energy. the PV installation may be necessary.
What is the difference between predicted, expected and measured energy production?
The Energy Performance Index (EPI) of a solar power plant is a metric used to assess the overall energy performance and efficiency of the plant. It generally represents the ratio between the actual energy output of the solar power plant and the theoretical or expected energy output under ideal conditions, taking into account factors such as solar radiation availability, system losses and operational factors.
The calculation of the EPI can vary depending on the specific context and methodology used, but usually involves comparing the actual energy production of the solar power plant over a certain period (such as a month or a year) with the expected energy production based on of factors such as installed PV power, site solar radiation level, system efficiency and other performance parameters. The figure below illustrates the difference between the predicted, expected and measured energy production of a solar power plant.

Many large-scale PV power plants around the world are underperforming due to a number of technical reasons. The EPI in many plants in the large portfolio (almost 4 GWp), evaluated by the Photovoltaica/UFSC laboratory in Brazil, is below expected performance, at levels comparable to the positive differences seen in the Solargis® Cards.
The image below from the Brazilian Solar Atlas, where all large-scale PV power plants (5 to 1000 MW) are superimposed on the solar radiation map, shows that most of them are located in the region where solar radiation in 2023 was 4 to 8. % higher than the long-term average of annual totals from 1999 to 2022, offsetting and masking the poor performance of these assets.

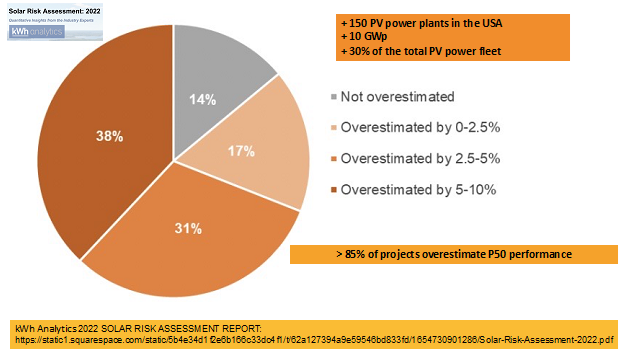
A recent Solar Risk Assessment report published by kWh Analytics shows that one in three solar installations in the US overestimates P50 estimates by more than 5%, as shown in the image below. In Australia, where solar and wind farms are often shut down for a few hours on many days each year due to negative prices, many large-scale PV installations are also underperforming, but untangling this information is difficult.
The EPI metric is used in monitoring PV power plants, assessing performance and evaluating contractual energy yield; Output certification of PV projects and due diligence for PV power plants; Commissioning of PV power plants and evaluation of field performance. If solar energy is to maintain its reputation as a low-risk asset class with predictable and stable long-term cash flows, large-scale PV power plants must operate at high EPI levels, taking into account the increase in solar radiation availability. as shown in 2023.
Authors: Prof. Ricardo Rüther (UFSC), Prof. Andrew Blakers/ANU
Andrew.blakers@anu.edu.au
rruther@gmail.com
ISESthe International Solar Energy Association is a UN-accredited member NGO founded in 1954 that works towards a world with 100% renewable energy for all, used efficiently and wisely.
The views and opinions expressed in this article are those of the author and do not necessarily reflect those of the author pv magazine.
This content is copyrighted and may not be reused. If you would like to collaborate with us and reuse some of our content, please contact: editors@pv-magazine.com.