

In a new weekly update for pv magazineSolcast, a DNV company, reports that January 2026 started with relatively mild, solar-friendly conditions across much of the eastern US, but ended with Winter Storm Fern, when a polar vortex disruption caused widespread cold, clouds and sharply reduced solar generation. A rare solar radiation storm at S4 level was also recorded in mid-January, although it had no direct impact on photovoltaic performance or solar data quality.
A relatively mild start to 2026 across much of North America gave way to a dramatic end to January as severe winter storms swept across the continent after a polar vortex disruption, analysis using the Solcast API shows. There was also a significant solar storm in late January, as detected by NOAA, although this is unlikely to impact solar power generation.
The eastern half of the United States generally fared better than average, with regions in Illinois and Kansas experiencing 15 to 20% more irradiation than the long-term average in January. Early in the month, a relatively stable polar vortex confined the coldest air to the north, allowing much of the continental United States to experience milder conditions than normal for mid-winter. This also limited the size and persistence of cloud systems in the eastern states, supporting more favorable solar conditions from the Great Lakes to Texas. North of the border, however, Canada continued to experience more persistent cloudy conditions. Farther south, a series of low-pressure systems off the Pacific coast of California and Mexico moved moist maritime air inland. This increased cloud cover in western Mexico, suppressing solar radiation compared to seasonal norms.
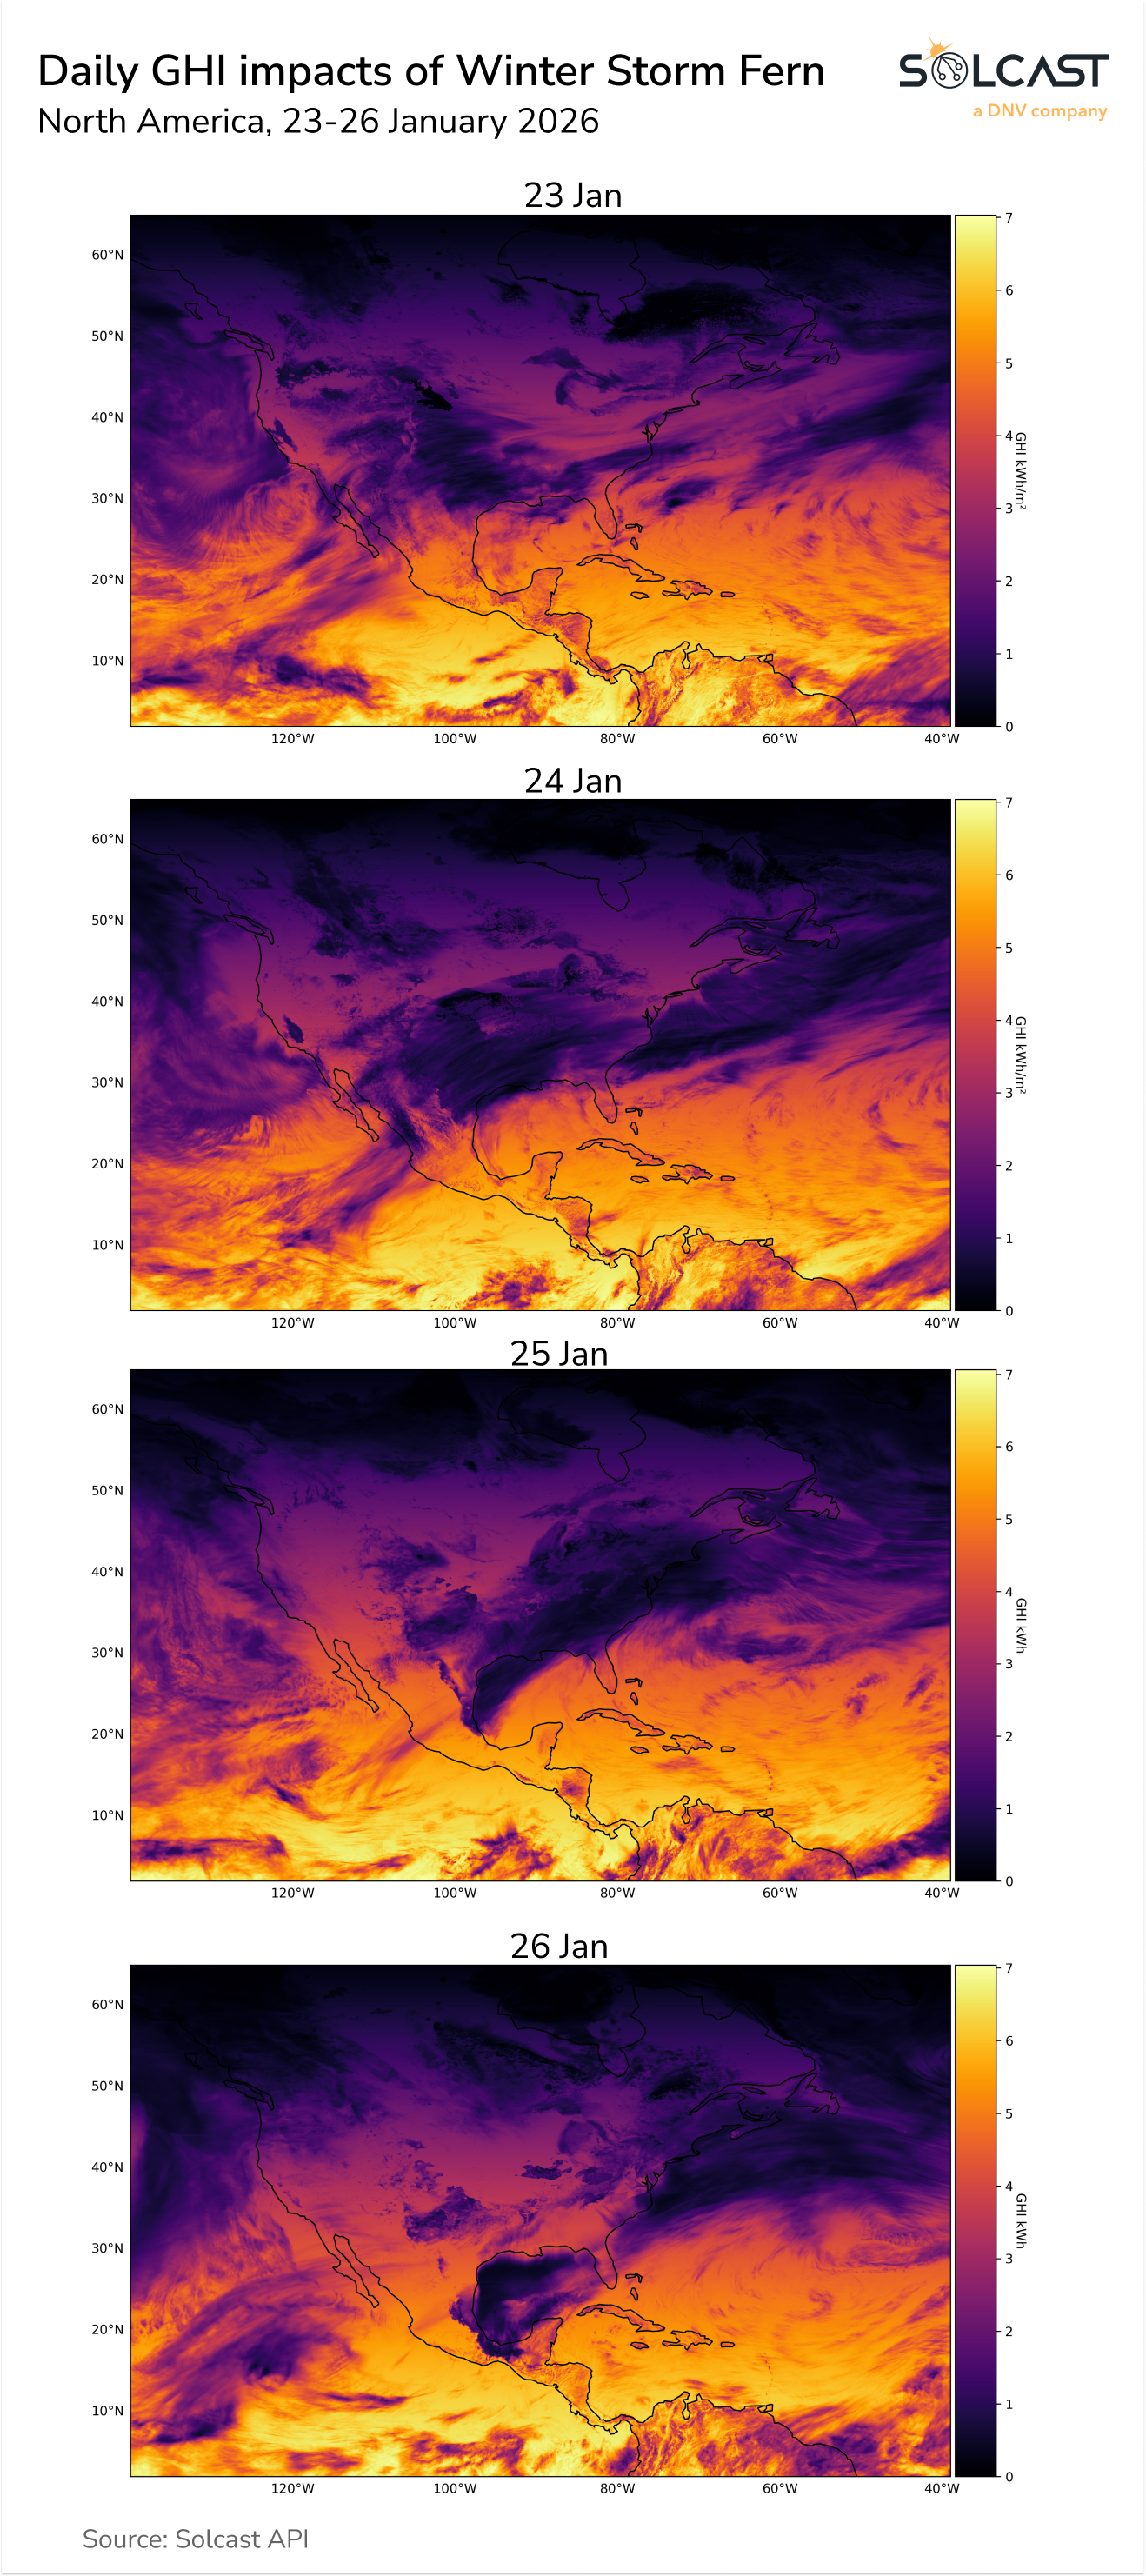
However, January’s defining feature came late in the month with Winter Storm Varen. This system brought widespread freezing temperatures, snow, ice, and dense cloud cover to much of the United States. The storm was caused by a disruption of the polar vortex due to warming of the stratosphere, a process that weakened the usual trapping of cold Arctic air. This disturbance was further enhanced by a low-pressure system in the Pacific Ocean, which helped deepen and direct the cold outbreak southward.

As the storm’s thick cloud shield moved across the continent, available solar radiation in affected areas fell to just a small fraction of normal winter levels. This is evident in data from the Electric Reliability Council of Texas (ERCOT) and ISO New England (ISO-NE), where solar power generation fell sharply as the storm’s clouds passed. At the same time, sharply colder temperatures increased heating demand, shifting the broader generation mix to non-solar sources during the peak of the event.

NOAA added a separate but notable dimension to the month, reporting a severe solar radiation storm on January 19, classified as S4 intensity. Events of this magnitude have not been observed since 2003. While such storms are unrelated to the surface radiation that drives photovoltaic performance, and therefore do not directly impact PV power generation, they can interfere with satellites. This includes the satellites used both by NOAA to assess solar radiation storms and by Solcast to monitor clouds and aerosols. However, in this case, no measurable impact on Solcast’s data quality was observed.
Solcast produces these figures by tracking clouds and aerosols worldwide at a resolution of 1-2 km, using proprietary satellite data AI/ML algorithms. This data is used to drive irradiance models, allowing Solcast to calculate high-resolution irradiance, with a typical deviation of less than 2%, as well as cloud tracking predictions. This data is used by more than 350 companies that manage more than 300 GW of solar energy worldwide.
The views and opinions expressed in this article are those of the author and do not necessarily reflect those of the author pv magazine.
This content is copyrighted and may not be reused. If you would like to collaborate with us and reuse some of our content, please contact: editors@pv-magazine.com.
Popular content
