

UK government figures show that 22,733 new solar PV installations were installed in April this year, bringing total solar capacity to 22.3 GW.
The added 107 MW in April 2026 contributed to an increase of 11.2% since April 2025, with 2.3 GW of additional solar capacity over twelve months. Figures published by the government today also show that nine of the ten best performing months for solar came last year, after In March, Britain reached more than 2 million installations.
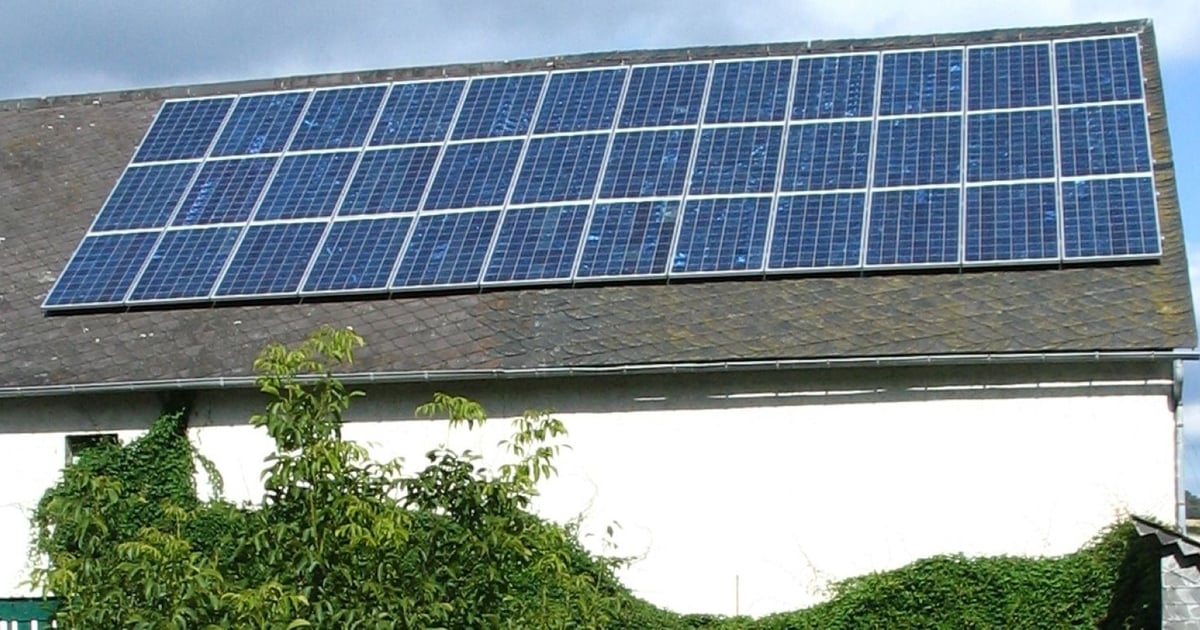
More than 50% of the new installations added in April 2026 were residential rooftop PV systems. Government research shows that of a total of 269,000 installations in Britain in 2025, around 255,000 were on roofs.
This means that last year 95% of all new solar energy was installed on roofs. The government said this amounts to a new roof system coming online every two minutes by 2025.
Energy Secretary Ed Miliband said: “As we face a second fossil fuel crisis in five years, Britain is taking back control of their energy by generating more clean energy than ever before. Record-breaking growth in solar energy means greater energy security and lower exposure to volatile fossil fuel markets that we cannot control.”
There is one increase in consumer interest in domestic renewable technologies in response to rising energy bills due to the conflict in the Middle East, with the government’s response to the energy crisis focusing on the cost-saving benefits of renewable generation. While the price ceiling for the coming summer period (July-September) will increase.
Chris Hewett, CEO of Solar Energy UK, commented: “These figures confirm what our members have seen on the ground: demand for solar energy is at an all-time high and UK households and businesses are responding to the energy crisis by taking control of their own energy bills.
In addition to tracking installation, the government published an annual index of the costs of installing solar energy. Across all installation sizes, costs per kW will have fallen by 2025.
The government figures are costs per declared net capacity, adjusted for inflation. The median cost of 0-4 kW installations has fallen by 9%, 4-10 kW installations by 8% and 10-50 kW installations by 3% compared to 2024/25.
Despite rising demand, increased supply and technological advances have pushed down average prices, the government said.
The larger an installation, the lower the cost per kW, but almost two-thirds of new installations in the 2025/26 analysis were domestic, of which 60% were in the 0-4 kW range. On average, non-domestic installations cost lower than domestic installations, government figures show.
More than 85% of domestic installations in the 2025/26 period were retrofitted, with the remainder installed in new-build homes, and as is a consistent trend, these are more expensive than installations in new-build homes. This is partly why the government has made it mandatory From 2028, all new homes must be equipped with solar energy as standard.
