

Credit: Alliant Energy
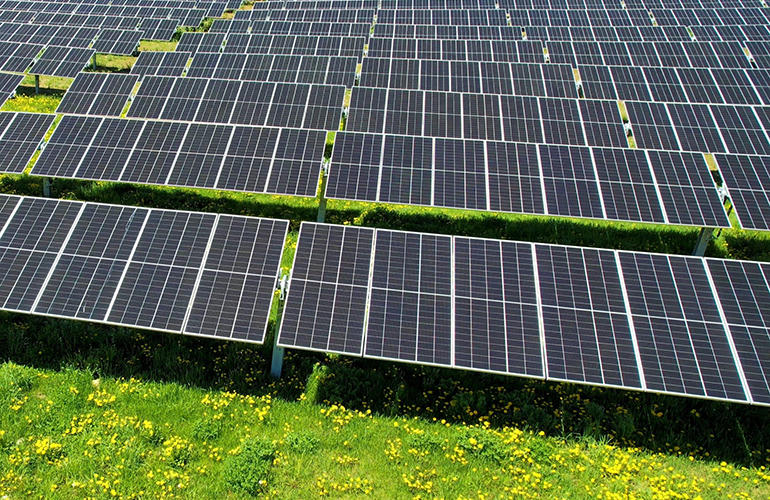
A review by the SUN DAY campaign of data recently released by the Federal Energy Regulatory Commission (FERC) shows that the mix of renewable energy sources (i.e. biomass, geothermal, hydro, solar, wind) was responsible for more than 90% of the total US electricity generation capacity added in the first two-thirds of 2024. August marked the twelfth month in a row in which solar was the largest source of new capacity, supplying nearly 100% of all new capacity.
Renewables made up 99.8% of new generation capacity in August and 90.1% in the first two-thirds of 2024
In his last monthly magazine “Update of the energy infrastructure” (with data through August 31, 2024), FERC says that 29 “units” of solar energy totaling 1,404 MW were deployed in August, along with one unit of biomass (3 MW). Combined, they accounted for 99.8% of all new production capacity added during the month. Natural gas provided the balance: 3MW.
During the first eight months of 2024, solar and wind added 16,546 MW and 2,270 MW, respectively. Combined with 212 MW of hydropower and 6 MW of biomass, renewable energy sources made up 90.1% of the added capacity. The remainder consisted of the 1,100 Vogtle-4 nuclear reactor in Georgia plus 977 MW of gas, 11 MW of oil and 3 MW of ‘other’.
Solar represented 99.6% of new capacity in August and 78.3% during the first eight months of 2024
The new solar capacity added from January to August this year was more than double the solar capacity (8,248 MW) added during the same period last year. Solar energy accounted for 78.3% of all new generation energy commissioned in the first two-thirds of 2024.
New wind capacity YTD accounted for a large part of the balance at 10.7%, but that was slightly less than the amount added in the same period in 2023 (2,761 MW).
In August alone, solar represented 99.6% of all new capacity added.
Solar energy is now the largest source of new generation capacity added every month for twelve consecutive months: September 2023 – August 2024.
Solar and wind energy now make up 21% of U.S. generating capacity
The combined capacity of solar and wind energy alone now constitutes more than one-fifth (21.0%) of the total available installed utility-scale generation capacity: wind energy – 11.74%; solar energy – 9.21%.
However, approximately 30% of US solar capacity consists of small-scale systems (e.g. on rooftops). is not reflected in FERC data. If you include that extra solar capacity, the share of solar and wind energy would be closer to a quarter of the national total.
With the addition of hydropower (7.7%), biomass (1.1%), and geothermal energy (0.3%), renewables now claim a 30.1% share of total U.S. utility-scale generation capacity.
Solar energy’s share of U.S. generating capacity is greater than nuclear or hydropower
The latest capacity expansions have brought solar’s share of total available installed utility-scale generation capacity (i.e. >1 MW) to 9.2%, ahead of nuclear (8.0%) and hydro (7.7%) has been further enlarged.
Installed utility-scale solar has now risen to fourth place – behind natural gas (43.3%), coal (15.7%) and wind – in terms of share of generation capacity.
Solar energy will soon become the second largest source of U.S. generating capacity
FERC reports that net “high probability” additions of solar energy between September 2024 and August 2027 total 91,167 MW – an amount more than four times the expected net “high probability” additions for wind energy (22,159 MW), the second fastest growing resource.
FERC also projects growth for hydropower (1,280 MW), biomass (124 MW) and geothermal (90 MW). On the other hand, there is no new nuclear capacity in FERC’s three-year forecast, while coal, oil, and natural gas are expected to shrink by 21,377 MW, 2,114 MW, and 1,606 MW, respectively.
If FERC’s current “high probability” additions materialize, solar will account for more than one-seventh (15.2%) of the nation’s installed generating capacity by September 1, 2027. That would be greater than coal (13.2%) or wind energy (12.6%) and substantially more than nuclear energy (7.5%) or hydropower (7.3%). The installed capacity of utility-scale solar would thus rise to second place – behind only natural gas (40.3%).
Meanwhile, the mix of all renewable energy sources would account for 36.4% of the total available installed utility-scale generating capacity – quickly approaching that of natural gas – with solar and wind energy accounting for more than three-quarters of the installed renewable energy capacity.
The combined capacity of all renewables, including small-scale solar, remains on track to exceed natural gas within three years:
As noted, FERC data does not take into account the capacity of small-scale solar systems. With that factored in, total U.S. solar capacity (i.e. small-scale plus utility-scale) will likely exceed 300 GW within three years. In turn, the mix of all renewable energy sources would then exceed 40% of the total installed capacity, while the share of natural gas would drop to around 37%.
Additionally, FERC reports that there is actually as much as 212,412 MW of net new solar energy in the current three-year pipeline, in addition to 67,395 MW of new wind energy, 8,944 MW of new hydro, 199 MW of new geothermal energy and 195 MW of new geothermal energy. of new biomass. The share of renewable energy sources could therefore be even higher by the end of summer 2027.
“Every month for an entire year, solar energy has led the way in delivering new generation capacity in the U.S.,” said Ken Bossong, executive director of the SUN DAY Campaign. “And it is poised to continue to dominate capacity additions over the next three years.”
News item from the SUN DAY campaign
