

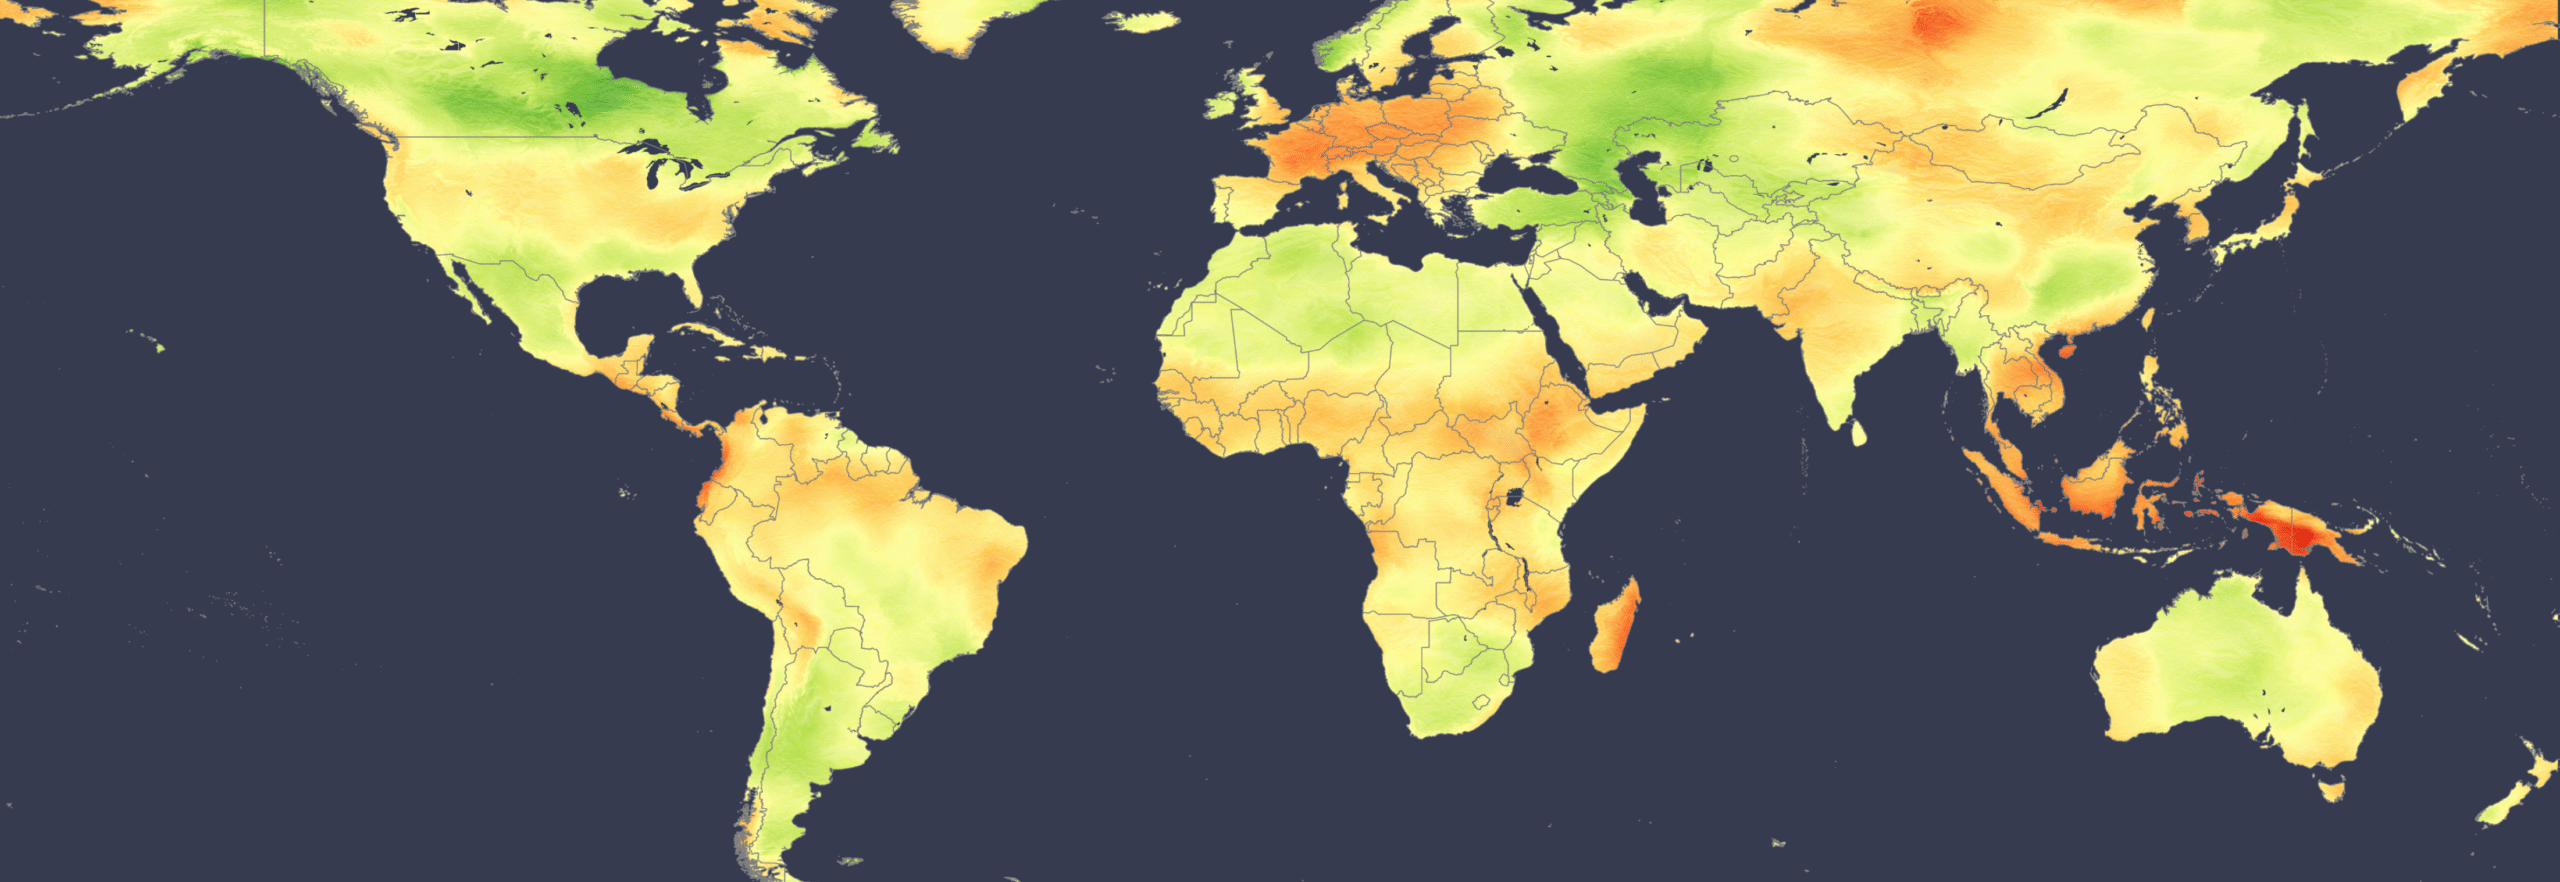
Southeast Asia is expected to see the strongest positive solar anomaly in the second half of 2026, according to an analysis using the Solcast APIwhile a strengthening El Niño and unusually warm oceans are shifting cloud and rain patterns in the tropics. The analysis of seasonal forecast models also indicates above-normal insolation in Europe, northern South America and eastern Australia, while parts of South America and North America at higher latitudes remain more uncertain.
The projection was compiled by comparing seasonal forecasts for the last six months of 2026 from four major meteorological centres: the European Center for Medium-Range Weather Forecasts (ECMWF), the UK Met Office (UKMO), the Japan Meteorological Agency (JMA) and the US National Centers for Environmental Prediction (NCEP). Comparing them shows where the models agree and where the prospects are less certain. Southeast Asia shows the strongest model agreement, with all four predictions pointing to above-normal insolation. Positive radiation anomalies also occur in parts of the tropics, including Africa and northern South America. High latitude areas of both continents are forecast to be cloudier. Most models place Central and Western Europe above the long-term average for insolation, while India is also expected to finish above normal. The models vary the most in North America.
The model comparison shows where the prediction is most robust: the agreement is strongest across Southeast Asia, while North America shows a greater spread between the models.
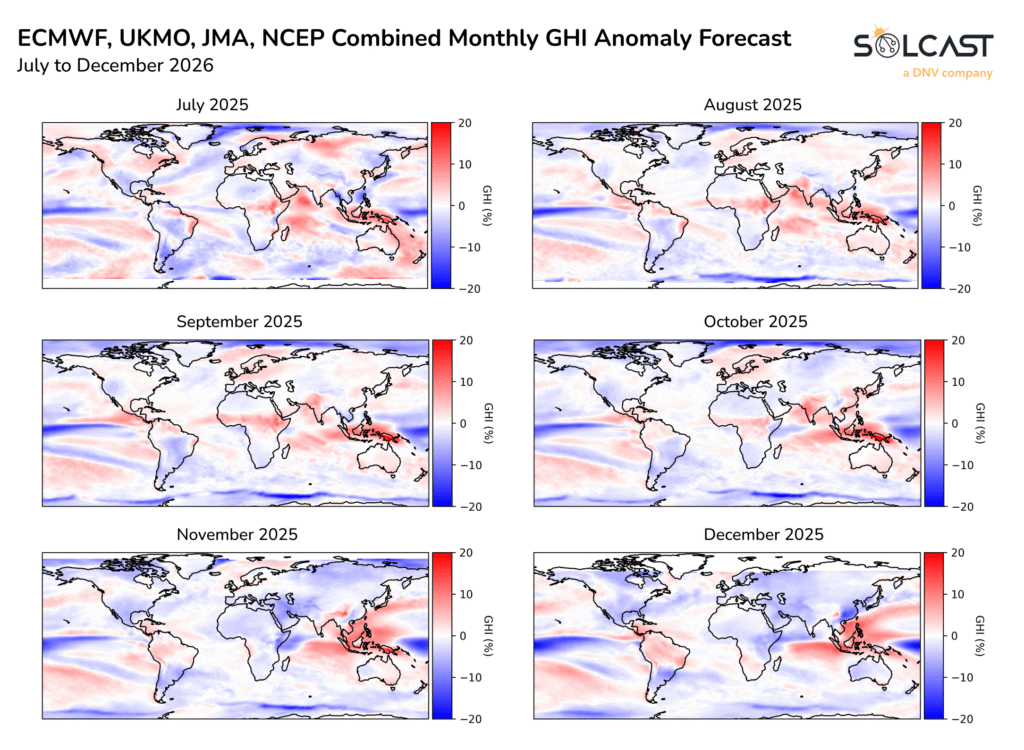
El Niño is a recurring climate pattern in which the tropical Pacific Ocean becomes warmer than normal, changing the weather over large parts of the world. There is broad agreement that this will develop into a strong to very strong event by the end of 2026, alongside high sea surface temperatures around the world. Monthly global horizontal irradiance (GHI) forecasts indicate that most regional anomalies persist until October, before the forecast pattern becomes more variable in November and December. China and the United States are the exceptions, with more variability expected from month to month.
The monthly GHI outlook shows whether deviations are persistent or temporary. In most regions, the sign of the anomaly remains largely stable until October, before more substantial shifts occur later in the year.
Combining these forecasts with Solcast’s analysis of the first half of 2026 gives us a picture of how the year could end, although the uncertainty in the forecasts means early year trends dominate in some regions. The end-of-year map combines the insolation already observed in the first half of 2026 with the forecast for the second half, and shows how the entire year will develop per region.
The end-of-year map combines the insolation already observed in the first half of 2026 with the forecast for the second half, and shows how the entire year will develop per region.
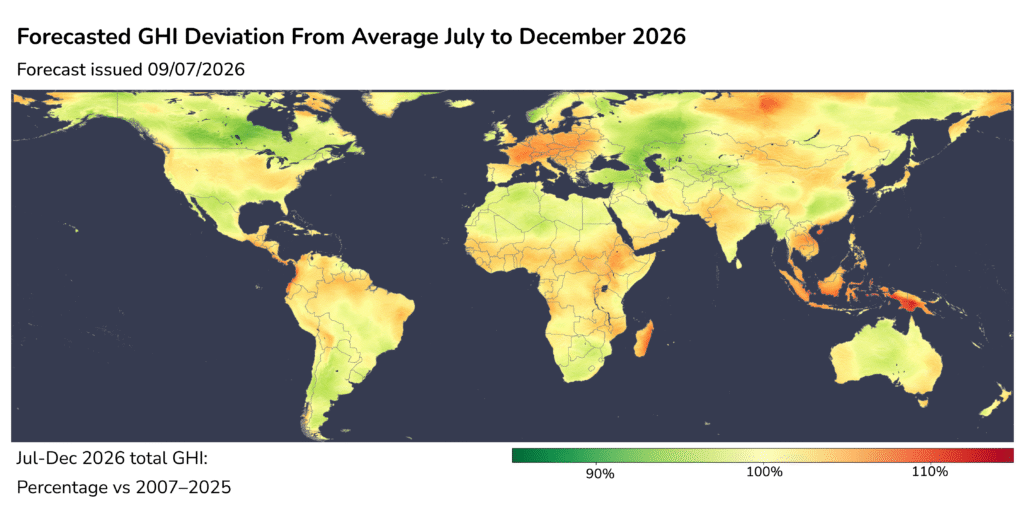
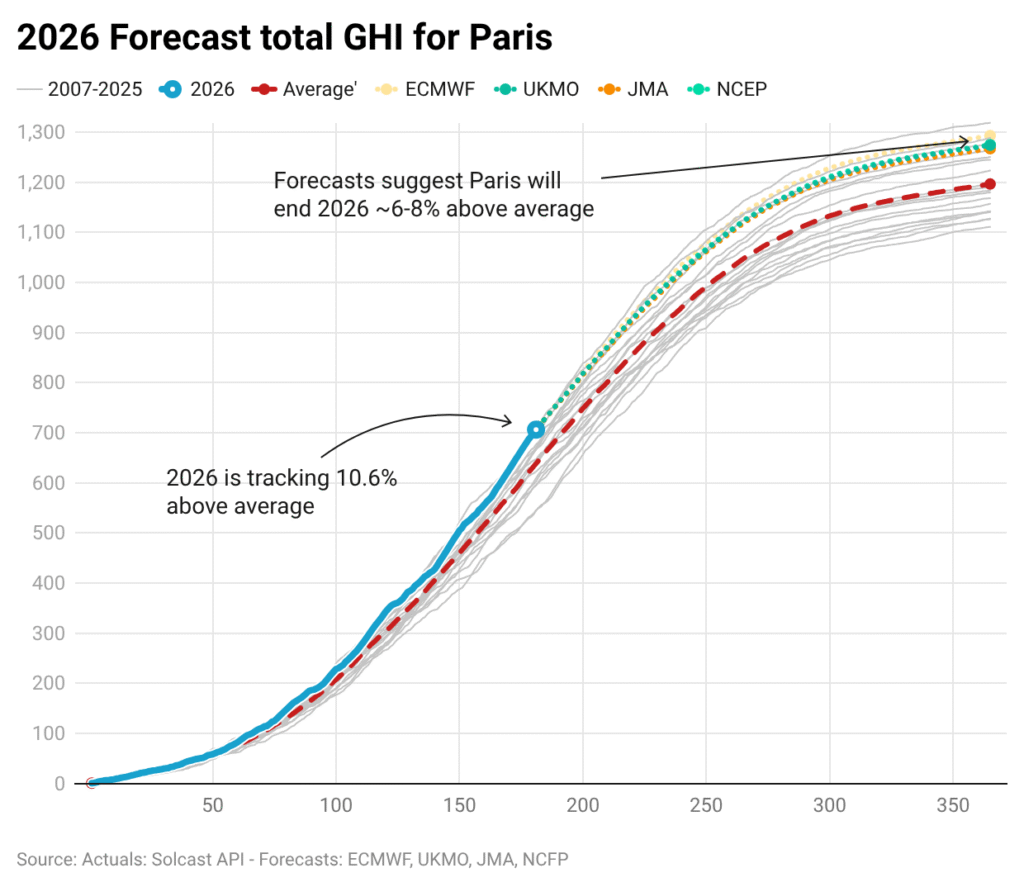
Europe’s positive first-half anomaly is expected to persist until the end of the year, especially in central and western areas, with some areas finishing around 5% above normal. The outlook suggests that reduced cloud cover is likely to maintain above-normal radiation intensity, rather than a reversal of early year-end gains. Paris illustrates the pattern, with cumulative insolation for 2026 being at the high end of the historical range.
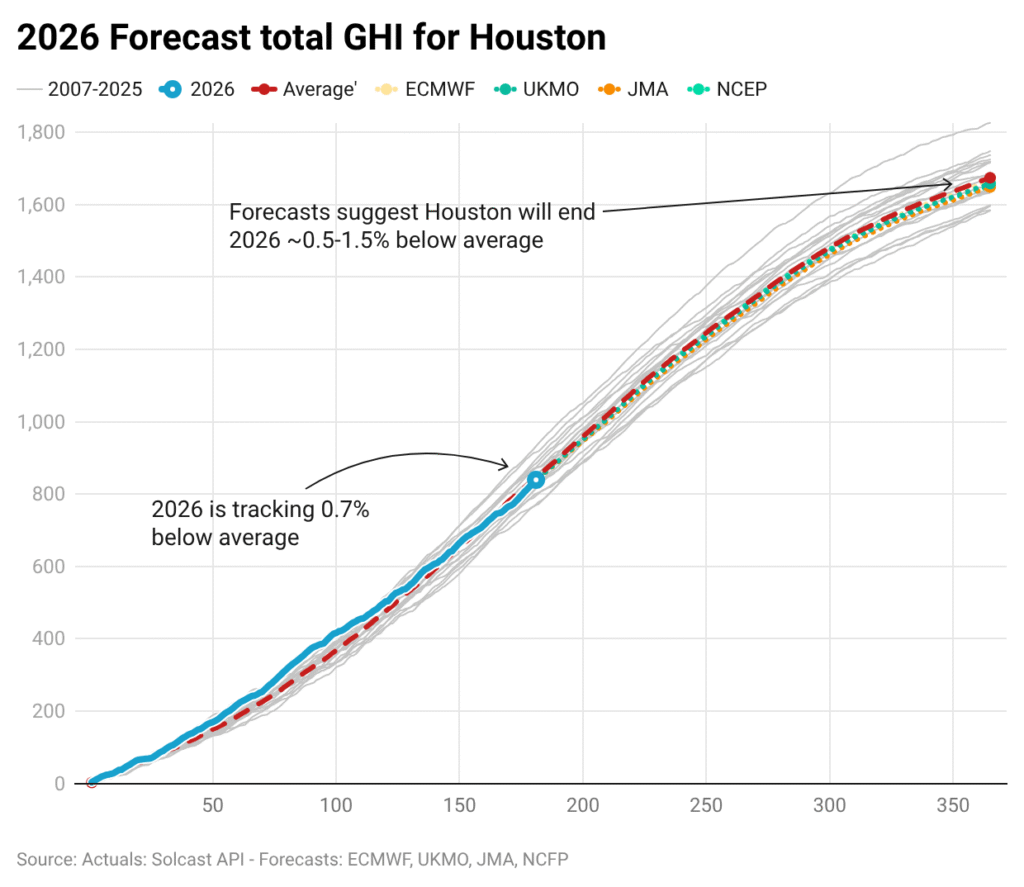
In the United States, reductions near the northern and southern edges contrast with increased insolation in parts of the central U.S., making the national picture positive overall but regionally uneven. Houston, near the southern border, starts strong but finishes slightly lower than average.
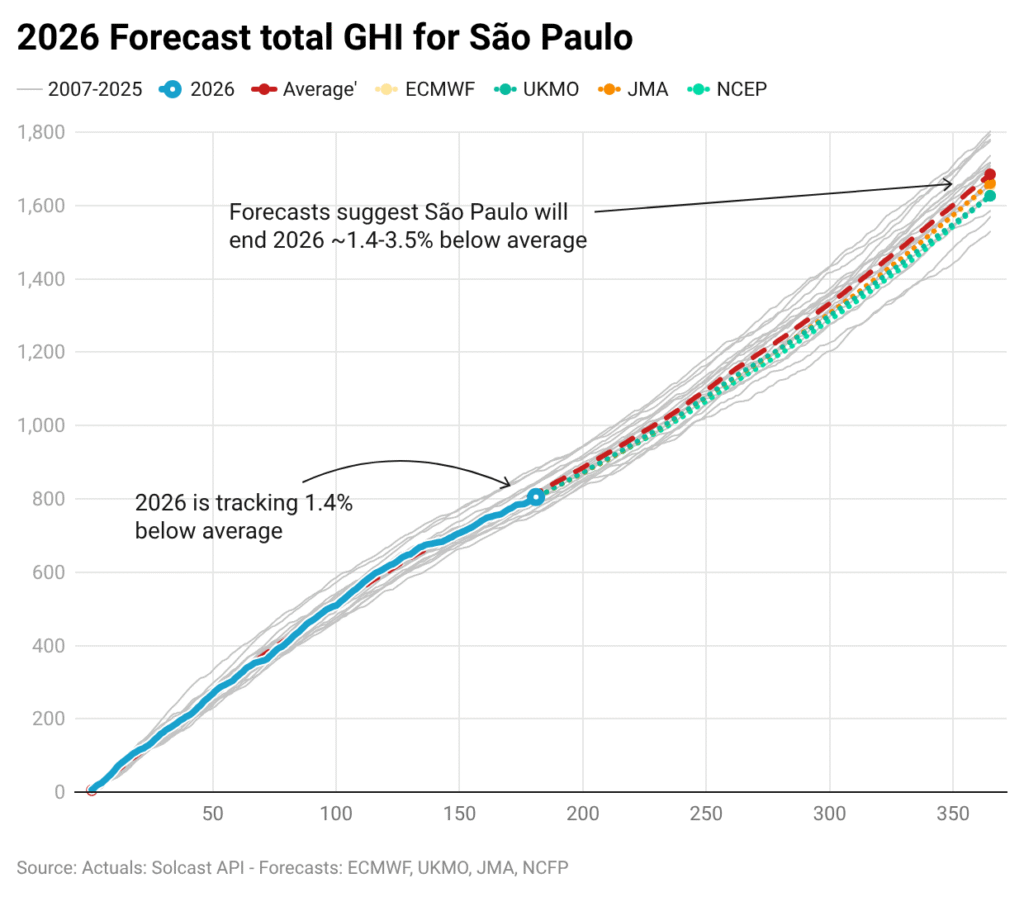
In Australia, the above-normal signal is along the east and west coasts, while the center of the country is forecast to be slightly below average. Northern South America is expected to finish above normal, while the south will finish below average despite a sunny start. São Paulo in the south is an example of this lower-than-average trend.
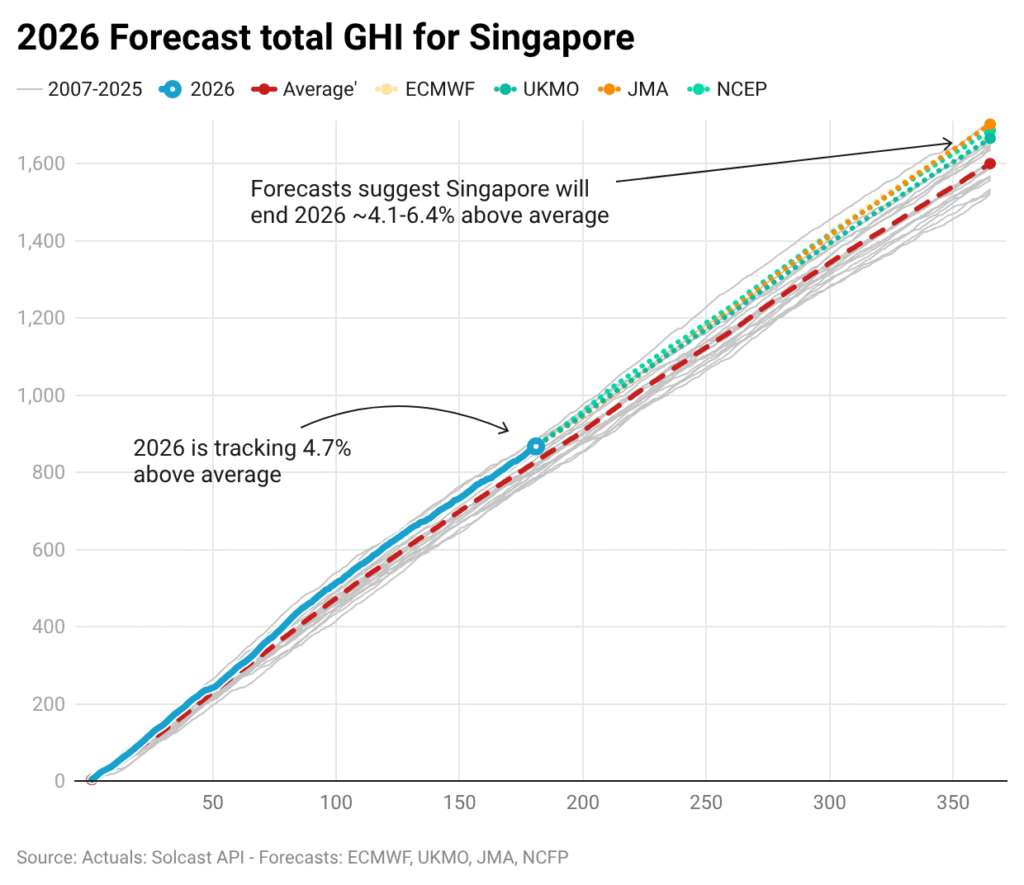
Across Asia, the clearest second-half anomaly occurs in Southeast Asia, where models agree on above-normal insolation. Coastal Asia, which was above normal earlier this year, is expected to move closer to the long-term average, suggesting the regional pattern will become more concentrated in the tropics rather than being broadly coastal. Singapore shows the effect at a single location, with the cumulative insolation for 2026 being at the high end of the historical range.
Solcast produces these figures by tracking clouds and aerosols worldwide at a resolution of 1-2 km, using proprietary satellite data AI/ML algorithms. This data is used to drive irradiance models, allowing Solcast to calculate high-resolution irradiance, with a typical deviation of less than 2%, as well as cloud tracking predictions. This data is used by more than 350 companies that manage more than 300 GW of solar energy worldwide.
