

In a new weekly update for pv magazineSolcast, a DNV company, reports that the regions with the largest year-on-year variability in insolation include Central and Northern Europe, the east coast of Australia, northern Argentina and China, with Africa having the most year-on-year shows stable irradiation.
Understanding the annual variability of solar energy potential is critical for network planning and storage optimization. An analysis using the Solcast API reveals regions with the largest variations in insolation from year to year. These data were compiled by looking at decadal variability, comparing the range of total annual irradiation with the average irradiation at each location. Interestingly, regions with high intradiurnal variability in the cloud are not necessarily the regions with the highest interannual variability.
The regions with the largest year-to-year variation in insolation include central and northern Europe, the east coast of Australia, northern Argentina and China. Africa shows the most stable insolation year after year.
In central and northern Europe, the high insolation variability is caused by the dominance of either the continental air masses in the south and east, or the maritime air masses from the Atlantic Ocean, the Arctic and the Mediterranean Sea. However, the Iberian Peninsula experiences less variability due to relatively consistent mixing of Atlantic and Mediterranean air masses.

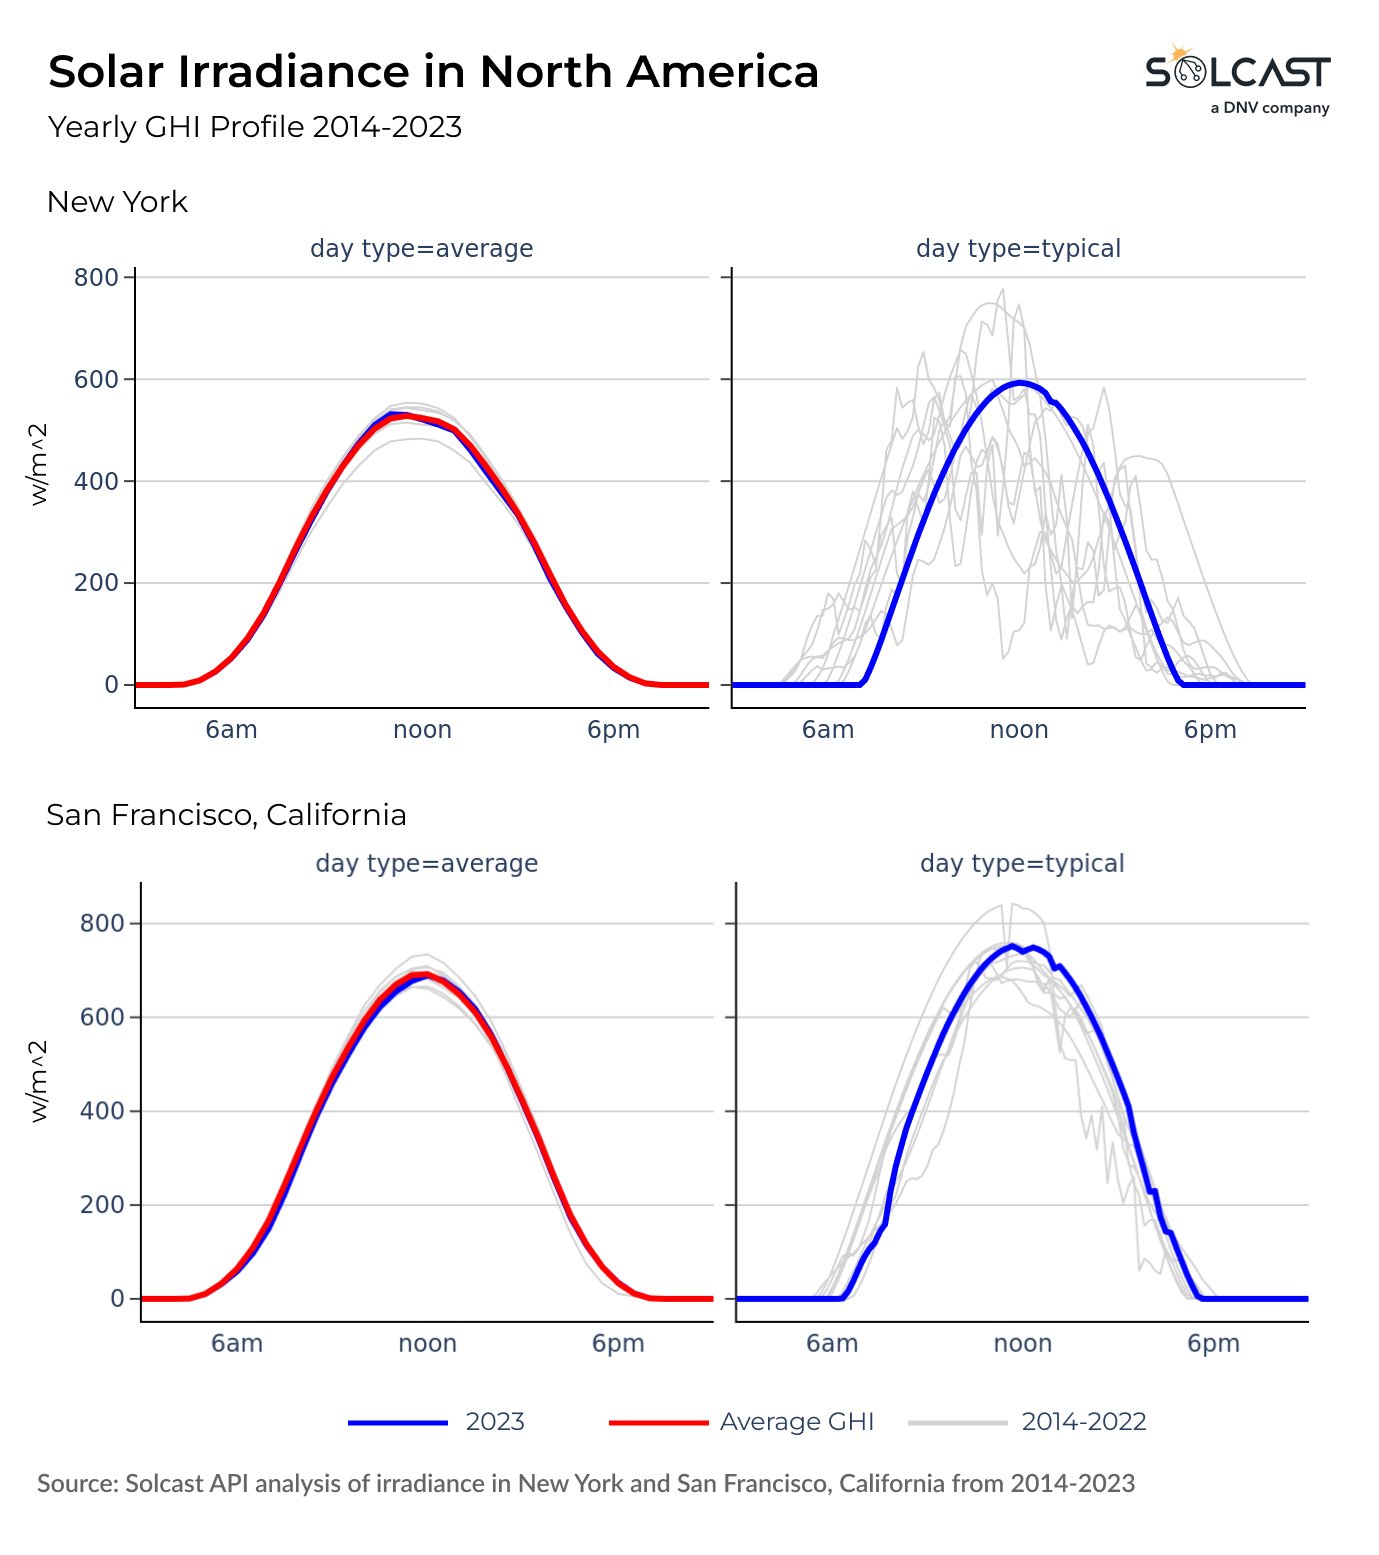
North America exhibits moderate variability in the Gulf Coast, Midwest, and Northeast regions, influenced by the interaction of moisture in the Gulf of Mexico, eastward-directed frontal systems in the Pacific Ocean, and Atlantic air masses. For comparison: the Rockies and West Coast show
relatively stable year-to-year insolation, dominated by westerly airflow from the Pacific Ocean.
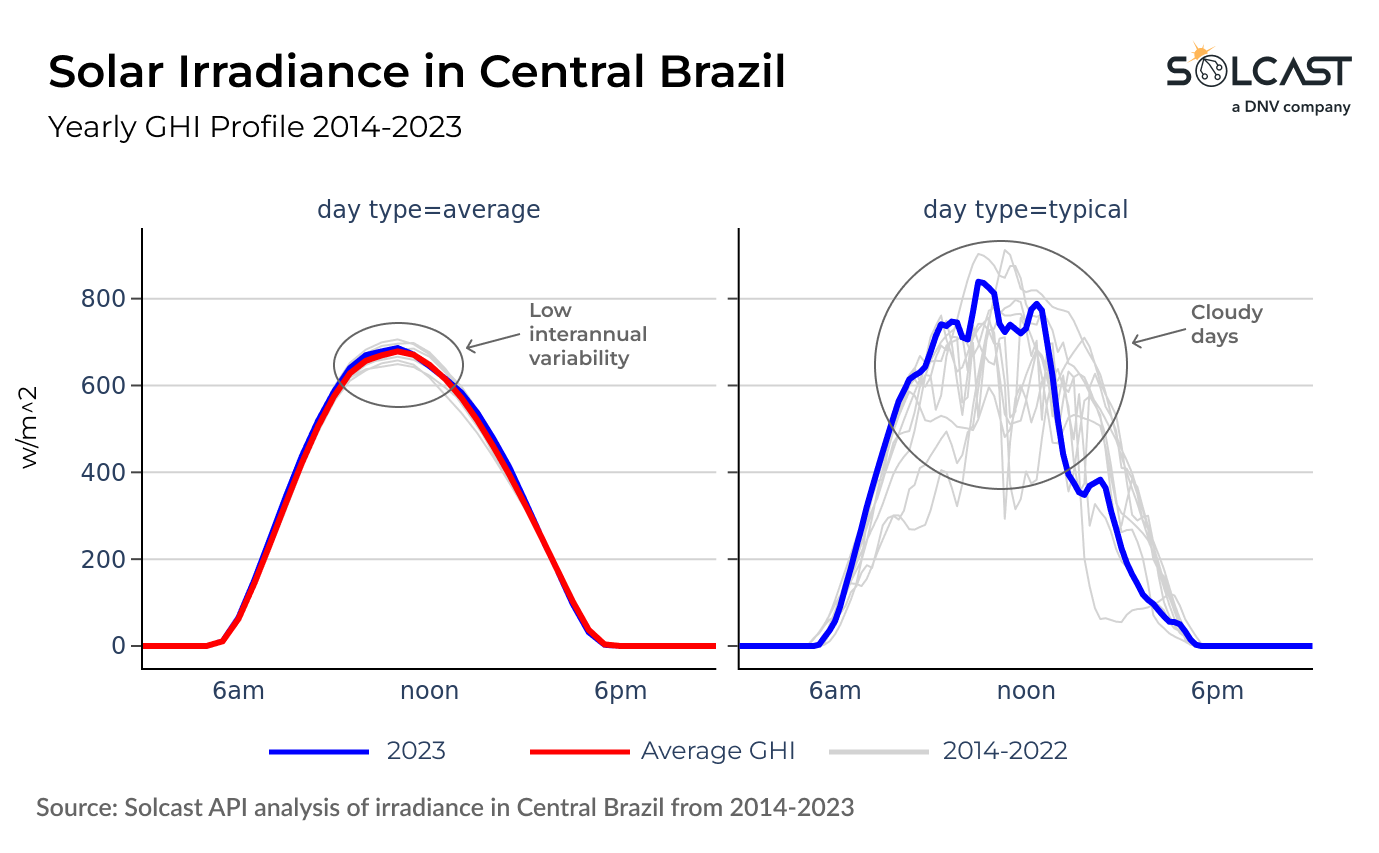
South America shows a contrasting scenario. Despite the large daily variability due to cloud cover and rainfall, the Amazon region maintains a surprisingly consistent amount of cloud cover year after year, resulting in a stable total annual insolation. The Atacama Plateau, similar to
Saharan Africa is exceptionally stable due to minimal cloud cover. Large fluctuations in annual irradiance are observed in northern Argentina, depending on how frontal systems in the Pacific Ocean interact with the Andes Mountains.
In India, the total insolation of the western region varies from year to year due to a less regular and consistent monsoon compared to that in the east. The large variability in China’s radiation intensity is partly driven by changes in aerosol loading over the past decade, with East Asia experiencing moderate year-to-year variability.
Saharan Africa and the Middle East exhibit the least variability in annual irradiance, dominated by cloud-free desert conditions. The sub-Saharan part of Africa remains fairly consistent from year to year, despite the tropical wet season. However, southern Africa experiences more variability due to the interaction between tropical and mid-latitude weather systems.
The Sunda Islands of Indonesia exhibit a large variation in irradiance due to shifts in the Madden-Julian Oscillation (MJO) and the Indian Ocean Dipole (IOD), which can drastically affect the intensity and duration of the biennial wet seasons.
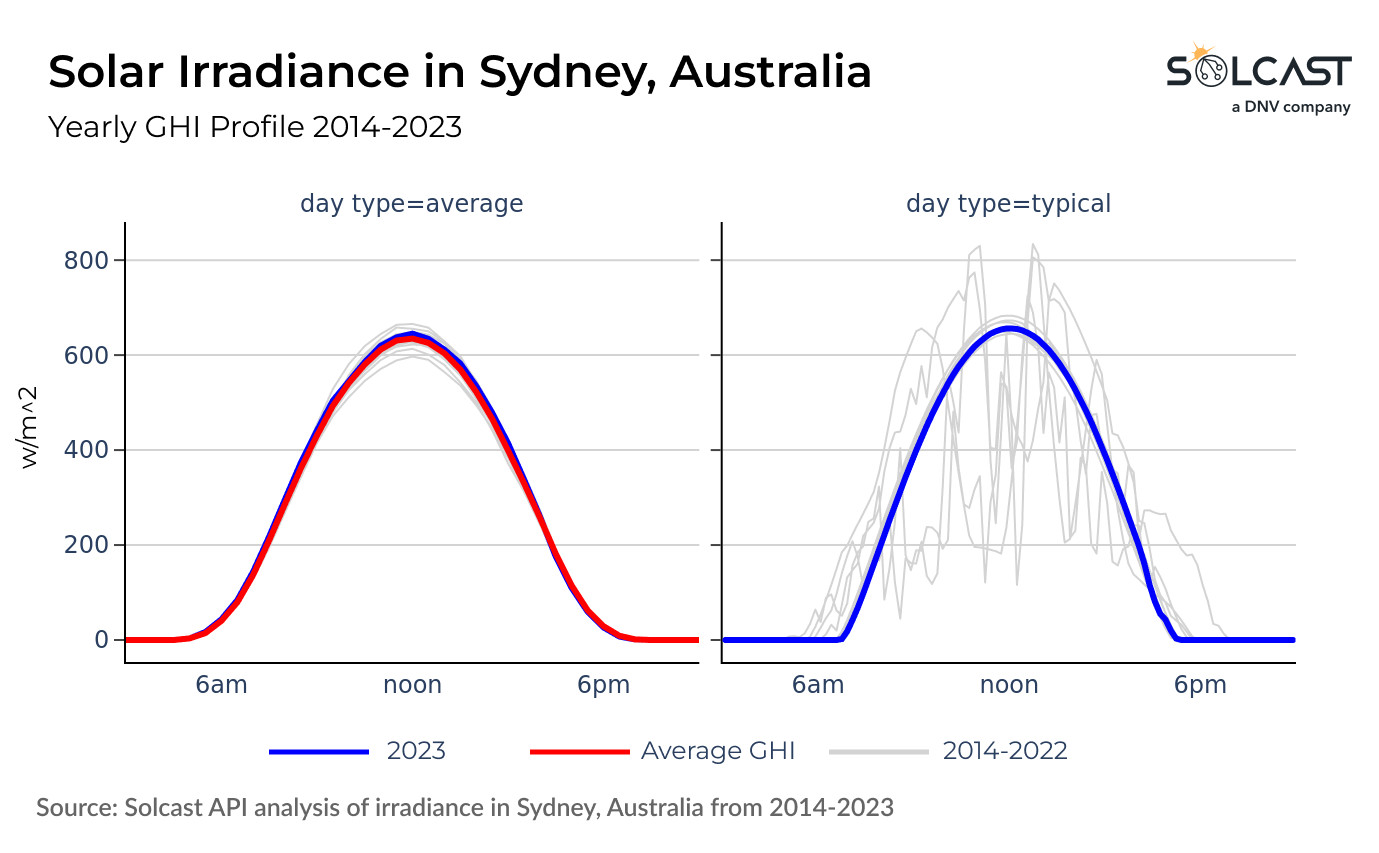
The east coast of Australia experiences large variability due to teleconnections to the El Niño Southern Oscillation (ENSO), which also influences variability along the northwestern coast of South America. The deserts of Central Australia are less consistently sunny compared to other deserts such as the Sahara, the Middle East and the Atacama Plateau due to the impact of ENSO. In contrast, northern tropical Australia has relatively stable interannual insolation due to the moderating influence of a consistent dry season that exceeds the variability of the wet seasons.
Solcast produces these figures by tracking clouds and aerosols worldwide at a resolution of 1-2 km, using proprietary satellite data AI/ML algorithms. This data is used to drive irradiance models, allowing Solcast to calculate high-resolution irradiance, with a typical deviation of less than 2%, as well as cloud tracking predictions. This data is used by more than 300 companies that manage more than 150 GW of solar energy worldwide.
The views and opinions expressed in this article are those of the author and do not necessarily reflect those of the author pv magazine.
This content is copyrighted and may not be reused. If you would like to collaborate with us and reuse some of our content, please contact: editors@pv-magazine.com.
Popular content